Index Reconstructor
A reconstruction of the S&P 500 index from its constituent stocks.
Overview
Pulling a list of S&P 500 companies and multiplying price by shares may seem like all that needs to be done to successfully reconstruct the index. However, a free data source like yfinance may hand us data that is subtly wrong in a way that never raises an error. Index Reconstructor rebuilds the S&P 500 from its constituents across a decade and tracks it to 0.99957 correlation of daily returns, but the reconstruction is really an instrument for finding out where available data may diverge from reality. Every basis point of tracking error had a cause, and each one turned out to be a specific defect: prices and share counts kept on different bases, a company counted twice, a ticker that changed its name, an index membership list that only knows who survived. A net share issuance strategy is then backtested on the result, to build on the data work done.
Problem
A backtest is only as trustable as the universe it runs on, and the defaults may be quietly biased. Today's constituent list applied backwards holds only the companies that survived. Split-adjusted prices paired with as-filed share counts misprice every company that ever split. None of this fails loudly: a missing stock is silently renormalised away and the weights still sum to one. The question is not whether we can compute an index, it is whether we can tell when our own data is wrong.
Solution
A cached pipeline that fetches constituents, prices, share counts, splits and the index change log, then derives clean dataframes from them. Membership is reconstructed point-in-time by walking 407 additions and removals backwards from today's list, and the universe is expanded to include delisted names so the data holds companies that have since been acquired or failed. Share counts are put on the same split basis as prices, dual-class companies are counted once, and renamed tickers are stitched to their old symbols. A validation layer reports what is missing on every run, scoped to companies that were actually index members that day. The backtest sits on top as a separate package that knows nothing about how the data was built.
Architecture
Five stages: Download → Clean → Validate → Reconstruct → Backtest. Downloads hit the network and cache to Parquet; cleaning is pure transforms over those files so derived dataframes rebuild in seconds without re-fetching. Validation reads the inputs rather than the outputs, because the outputs cannot show the problem: dropping a stock renormalises the rest, so the weights sum to one whether or not half the index is missing. Reconstruction is elementwise market cap, row-normalised weights, a one-day weight lag and compounding. The backtest imports only the pipeline's entry point, so the same strategy can be re-run against a different universe by changing one line, which is how survivorship bias was measured.
Tech Stack
Challenges
- auto_adjust=False does not give raw prices, it only excludes dividends. Prices were split-adjusted a decade back while share counts were as-filed, so NVIDIA was carried at 0.31% weight against a true 3% through the period it led the market. I scaled each day's share count by every split that came after it.
- Nothing reported missing data. A stock with no share count silently dropped out and the remaining weights renormalised, so my sanity check that weights sum to one could never fail. I replaced it with checks that read the inputs and found the universe had been as low as 474 names.
- Yahoo switches to post-split share counts before the split's effective date, and not consistently. Booking Holdings showed post-split counts from February for an April split, pre-split counts again in late March, so scaling by the split ratio gave it a $4tn market cap and 6% of the index. My first fix derived the boundary from where the count actually steps, which worked until I found the series flip-flops. I settled on scaling first and then repairing values that came out a whole split ratio too large.
Lessons Learned
- Data quality does not fail randomly, it fails at corporate actions. Splits, renames, dual-class listings and index membership changes broke every panel I built, and each one broke it differently. Prices and share counts are maintained on different conventions by the same vendor, so the two agree everywhere except exactly where a company did something.
- The S&P is float-adjusted and divisor-managed, and both of those exist to solve problems I hit head-on. The divisor absorbs buybacks, issuance and membership changes so the published level does not jump on events that are not price moves. Without one, every corporate action leaked into my series.
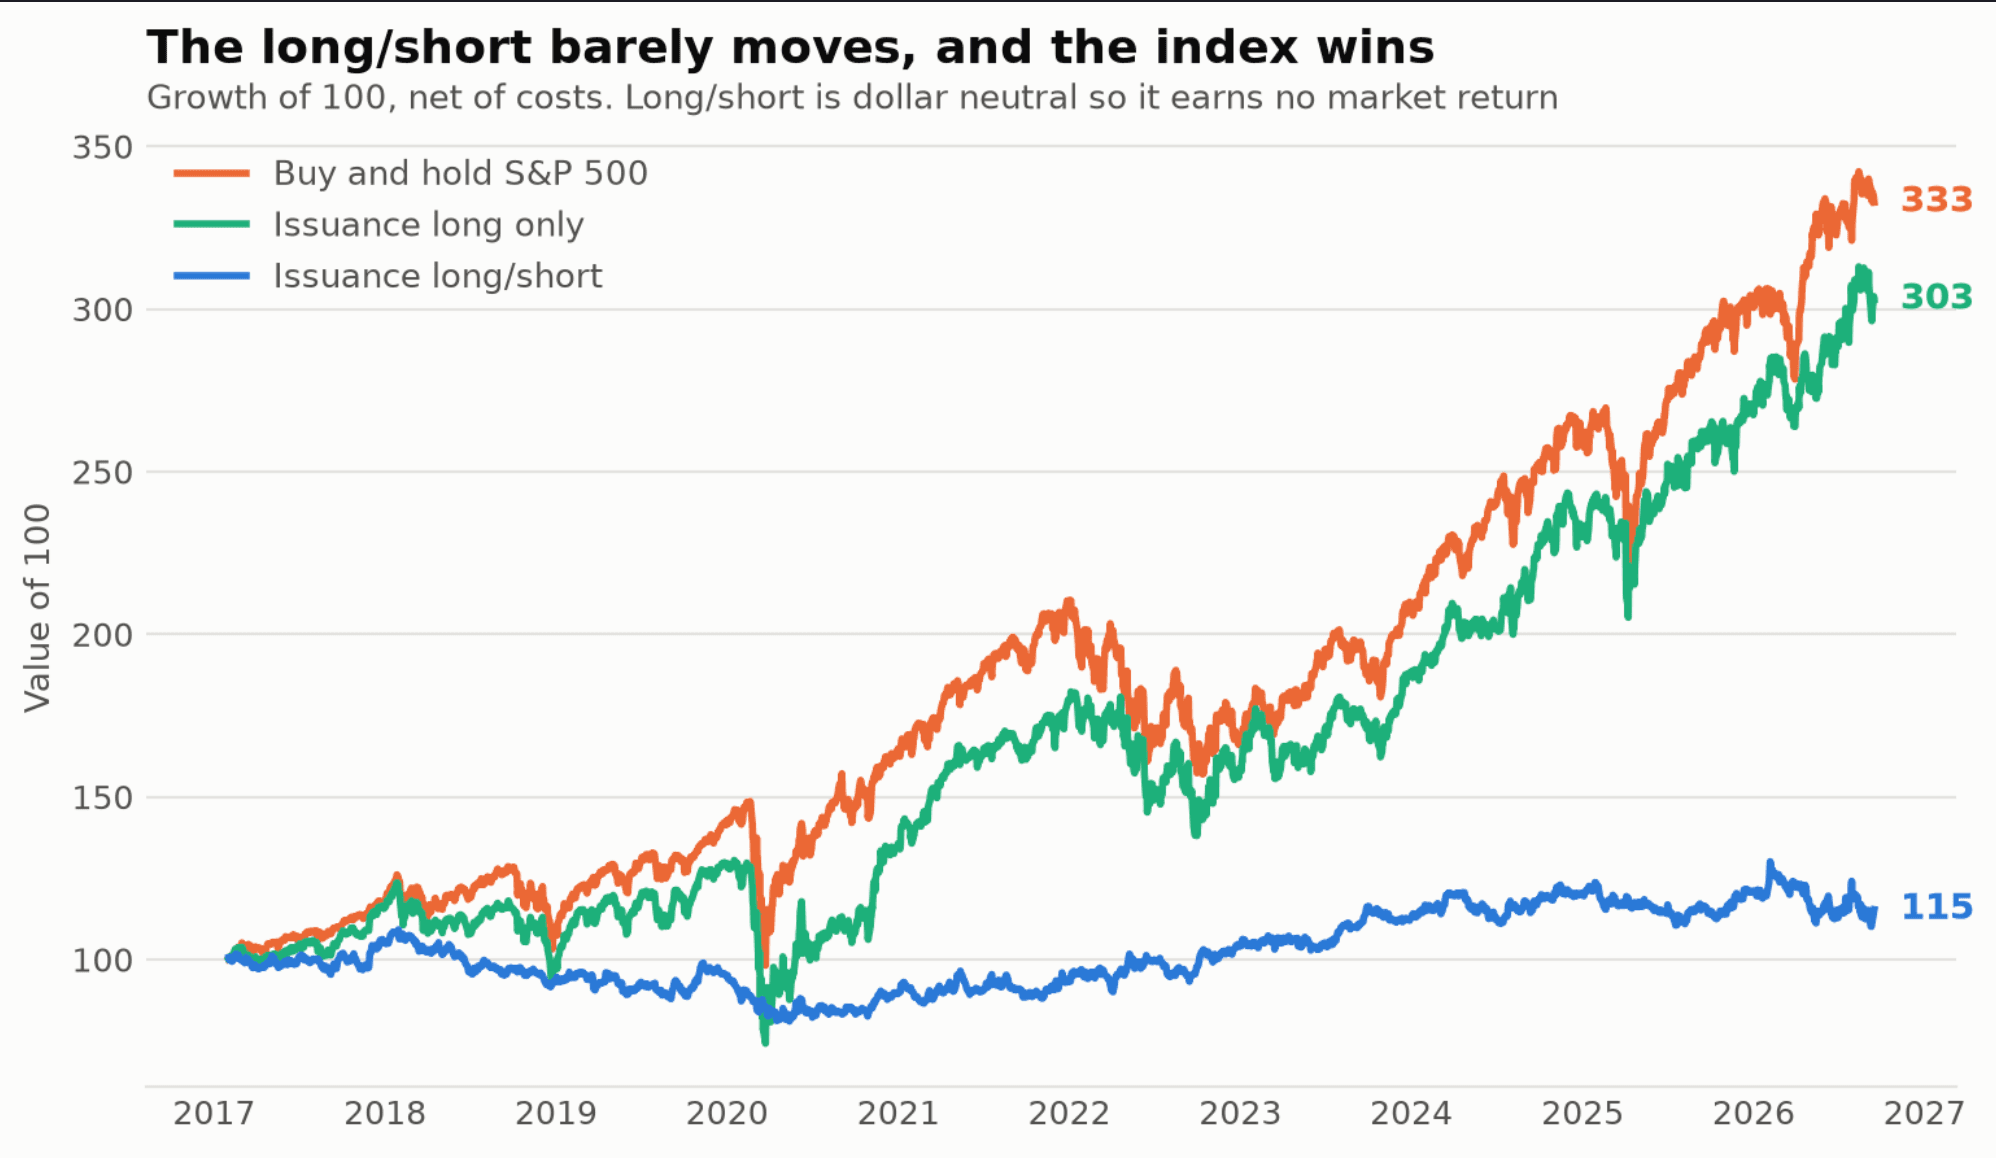
- A dollar-neutral book gives up the market return entirely, so it has to generate real alpha just to draw level with buy and hold. Mine returned 1.5% a year against the index's 13.4%, and long-only on the same signal returned 12.2% with negative alpha, meaning almost all of it was market exposure rather than the signal working.
- Rebalancing more often cost me gross return, not just net. Moving from monthly to daily cut gross from 2.5% to 0.2% a year before costs, because only about 77 of 408 names have a signal that changes on a given day and re-ranking the rest just churns the decile boundary. Frequency should match how fast the information actually arrives.
- Fixing data can make the headline number worse, and that is usually correct. Removing survivorship bias cut the strategy's Sharpe by a fifth, which is the point rather than a regression.
- A signal can be entirely one-sided. 69% of S&P companies shrink their share count in a given year, so buying back stock carries almost no information and the long leg had no edge at all. Whatever the issuance factor is worth, it lives in shorting the companies that dilute.
Future Improvements
- Roughly 3% of historical index members cannot be priced at all once they are acquired, fail or go private, and the fraction grows the further back the window goes. A second data source would bound that better than Yahoo alone.
- Share counts come from one vendor whose dating convention is undocumented. Only 0.6% of observations land on quarter ends, so whether a value was knowable on its stated date is unverifiable, and that is a lookahead risk no backtest can detect from inside.
- The issuance strategy's short leg is an implicit bet against REITs and utilities, which issue equity persistently. Ranking within sectors would separate the signal from the sector tilt.
- The window floor of 2016 is a data limit, not a choice, since share counts do not exist before late 2015. Extending further back needs a paid point-in-time provider.